
Performance Max offers the best of Google’s AI-powered tools without relinquishing control, and it shows more transparency than AI-Mode ad hopefuls. It’s the most exciting campaign type in Google Ads.
With Google unveiling the new Performance Max (PMax) channel reporting betas, it seems like we will finally get the best of both worlds: aggressive automation and transparent reporting. Even without direct channel controls, there are ways to guide PMax campaigns in a given direction.
To understand why PMax matters, we must first discuss Demand Gen campaigns and how they factor into a successful paid search strategy.
A Brief History of Demand Gen
Demand Gen was the first campaign type to offer the ability to increase coverage across multiple high-value channels, specifically YouTube, Discover, Gmail, or Display Network.
- 2019: Google launched Discover campaigns, initially limited to the Discover feed on mobile devices.
- 2020: Discover campaigns expanded to include Gmail and YouTube home feed placements.
- 2023: Google announced Demand Gen campaigns at Google Marketing Live as the replacement for Discover.
- October 2023: Demand Gen campaigns rolled out globally and fully replaced Discover in the Google Ads UI.
- February 2024: Google introduced audience expansion and lookalike targeting for Demand Gen.
- August 2024: Google added ad previews, creative testing tools, and asset performance labels to Demand Gen.
- July 2025: Video Action Campaigns were upgraded to Demand Gen campaigns with no opt out.
Today, Demand Gen is touted as a key member of the power packs for lead gen and retail.
The ability to traffic spend across disparate channels while choosing where your ads show is indispensable. But because Demand Gen cannot deliver for paid search on Google.com, other campaign types are an essential part of any comprehensive strategy driving down-funnel traffic. This is how PMax campaigns carve out their niche in the Google Ads ecosystem.
An Even Briefer History of Performance Max
Now, let’s talk about PMax and how we got to where we are today.
- 2021: Google launched PMax. The new campaign type combined Search, Shopping, Display, YouTube, Gmail, Discover, and Maps into a single campaign.
- 2022: Smart Shopping and Local campaigns were automatically upgraded to PMax. (Google typically rolls out automatic upgrades to increase adoption of new features.)
- 2023: Google added search category–level insights to PMax campaigns. This update offered limited visibility into intent but provided important context to marketers.
- 2024: Negative keyword additions became available to PMax campaigns, allowing us to narrow our focus and better design strategies to meet our needs.
- Spring 2025: Google launched the channel performance beta, which shows performance within PMax campaigns by channel.
It took four years for the ability to concretely see where our PMax campaigns were actually serving ads and spending budget. Now that we have the ability to view channel-level performance for these campaigns, the real question is what we’ll do with it.
The Channel Performance Report View
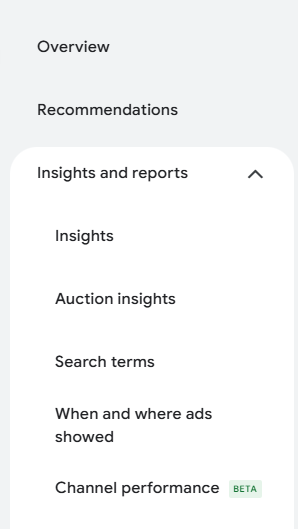
You can view channel performance within PMax campaigns by navigating to the insights and reports section, where it should be visible within the dropdown.
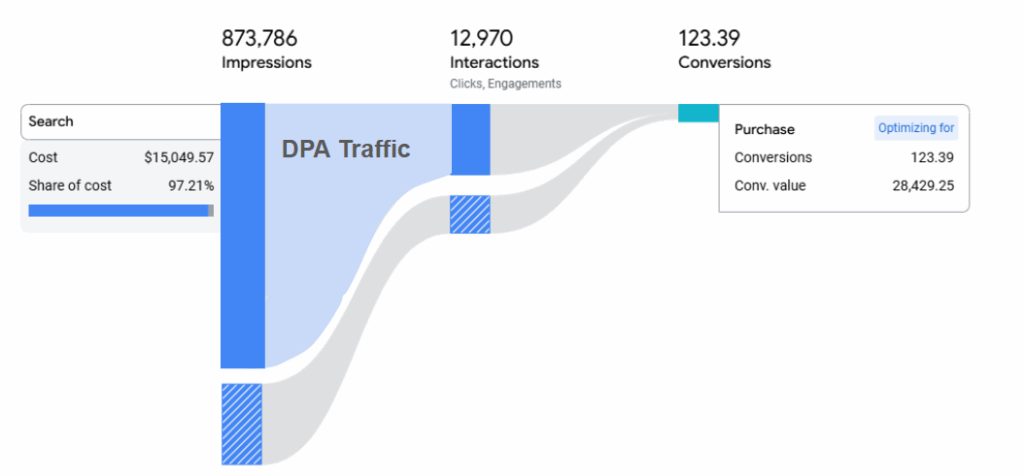
You’ll see a somewhat intimidating Sankey diagram when you first view the report, but this can be easily filtered to show only what you need.
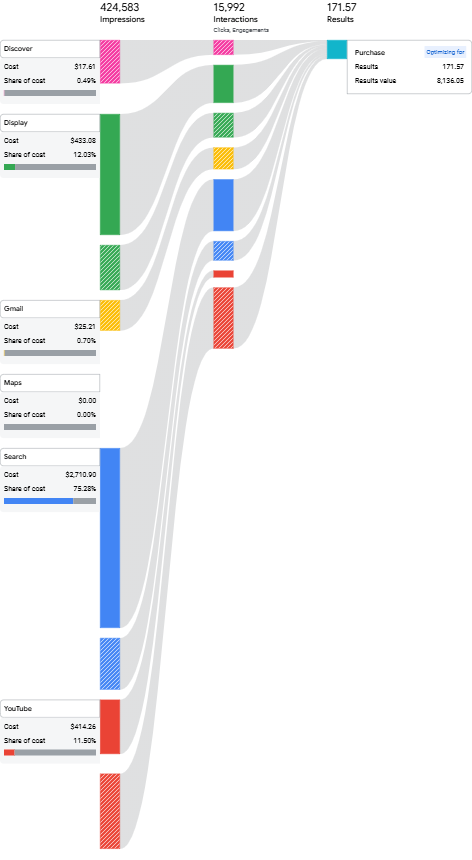
Below, we’ve filtered to show a single channel, with spend and traffic broken down by product data (dynamic product ads, or DPAs) versus no product data (standard ads). You can also filter to show either results or conversions, so you can calculate CPA or ROAS at the channel level.

It may seem like you have to look at the data separately. But if you select all PMax campaigns at once and pop into the report, you can download the table export at the bottom, then sum each channel’s performance together. Unfortunately, other reporting features—including Google’s dashboards—can’t yet replicate or pivot out this data, but that’s what we’re here for!
Performance Max: Search vs. Everything Else
Before we break into the channels we can see using the fancy new tools Google has given us, let’s look at an old-school method that works regardless of the channel performance breakout. What this method tells us is in some cases, even more important, and it all happens at the search term level.
In PMax campaigns, since March 2025, we can see search term level delivery by navigating to the search term report as we would for other campaign types.
Any spend not associated with search terms or other search terms is going to non-search channels. This is proven by cross-referencing the search terms report against the channel performance report. In this example, we can see that of the roughly $1.6K in spend over the last seven days, only $1.2K is attributed to search terms, leaving around $400 for other forms of delivery.
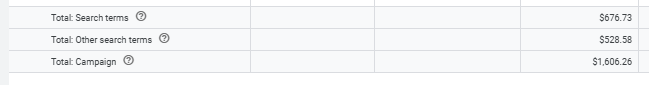
This aligns with the roughly $400 shown in the channel performance report for the same campaign, attributed to delivery through non-search channels. This analysis is important, as it’s not guaranteed that every account will have access to channel reporting.

Don’t Let Search Wither on the Vine
Beyond the channel performance breakdown, it’s also clear that PMax search elements can be reduced severely if conversions are not far enough down the funnel. Campaigns will go from delivering robust search term volume to maxing out their budgets on upper-funnel spend.
This is fine if it matches your objective, but it will not result in a well-balanced campaign.
In one instance, a new PMax campaign delivered strong search term results relevant to our goals—a relatively standard outcome. However, after three weeks of delivery, we began to see conversions through channels outside of search. This led to accelerated changes in campaign spend distribution across channels. In just seven days, our campaign went from a multichannel effort driving quality leads to a single channel driving high impressions and poor quality leads.
- Google gave search channels just two days to beat out the upper-funnel campaigns.
- Seven days after the first conversion on a non-search channel, the campaign had optimized to deliver 100% of spend outside of search.
- After three weeks, search was down to 5% of spend.
- After six weeks, search was completely dead.
This is an important distinction for lead gen, where quality makes all the difference. By launching smart campaigns, we put Google’s algorithm in the driver’s seat. But we have to make sure it’s going in the right direction.

Why Is Shopping Missing From the Channel Performance Report?
Shopping is the only channel that is not included in the PMax search channel breakdown feature. What we get instead is reporting on DPAs, the majority of which are delivered through the search channel.
That’s why search is the best channel to deliver for in PMax. It takes all the benefits of match types in responsive search ads (RSAs) and combines them with the AI that determines user interest based on multiple signals and behaviors.
In retail efforts, especially on the search channel, expect to see around 75% or more of your ads delivered using product data. DPAs have an average ROAS over twice that of their non-product-ad counterparts.
You can see the amount of spend going to DPAs by looking at the product ad section of the breakdown. These DPAs are showing outside of just the Shopping section of standard search (although they’re definitely there, too!). Of course, as with all other channels, how much goes to product ads is going to vary based on early conversion patterns.
Gmail Ads and Platform Comparable Conversions
The signal that really pushes PMax around is much simpler than you may think. We can understand this by looking at an oft-overlooked channel: Gmail.
For most retail campaigns, Gmail is something of an afterthought in the channel performance breakdown, rarely comprising more than 1% of total spend. But when a conversion does occur on this channel, especially early on in its performance, it can tilt the scales away from search.
In the above example, before generating a conversion, Gmail only comprised around 0.85% of total spend. Once a conversion was generated, spending on the channel increased by more than 200% in just seven days. A month after those initial conversions, Gmail was dominating 90% of spend within the PMax campaign.
This is a significant departure from what we typically see in PMax campaigns. Unsurprisingly, the converting traffic driven by this channel was a result of DPAs.
On the other hand, for one client, we did see strong performance from the Gmail channel within PMax. We then implemented Gmail-only Demand Gen, driving a 50% reduction in CPMs for ads delivered on the channel. We also saw success further down the funnel, but how that is reported in-platform somewhat muddies the impact.
One nuance of Demand Gen Gmail campaigns is how conversions are tracked. It’d be easy not to notice, but when you are looking at the platform report for Demand Gen campaigns, you’ll be able to add a new column for “Conversions (Platform Comparable).”
These are basically view-through conversions with a slightly narrower focus (those directly stemming from Demand Gen). While they may not match best practice conversion numbers, the KPIs we can yield from this metric are still a valuable watermark to check against aggregate performance.
Although direct conversions were lower, Platform Comparable reporting indicates Gmail-only Demand Gen consistently delivered a ROAS in line with the omnichannel ROAS for our PMax campaigns in the account.
Maps—You Can Only Find Them in Performance Max
For businesses tracking store visit conversions, the Maps channel can be a valuable tool. However, due to how campaigns optimize, there are a few quirks.
- If you don’t have store visits as a goal, it’s unlikely your PMax campaigns will expand to cover Maps placements.
- If you do have store visit conversions as a goal, your PMax campaigns will serve on the Maps channel. It might even be the primary channel for your campaign.
Why Google May Start Delivering for Maps
We saw conversions impact campaign spend across channels in the upper funnel, and the same is occurring in Maps. Unfortunately, beyond extraneous geographic delivery, this pushes valuable channels to the wayside.

In the first week of delivery, we saw spend shift immediately to the Maps channel, only tossing a few dollars in the directions of Search. And even though the Maps channel had the strongest CPA during this period, after three months of delivery, it actually had the worst CPA of all three.
| Channel vs. Cost Per Store Visit (CPA) | ||
| Channel | First 4 Days | 3 Months |
| Maps | $10.33 | $10.39 |
| Search | $16.21 | $1.68 |
That doesn’t mean all Map traffic is bad, just that it has a tendency to bulldog its way to the top of the pyramid. With this in mind, it’s important to understand how the channel’s behavior can impact other elements of strategy—namely, geotargeting.
When Maps Campaigns Go Off-Road
When you’re tracking foot traffic to a physical store, you’re not going to want to expand your reach to users that are “interested in” the areas you serve. (If you happen to be interested in interest, check out this article where we talk about the best way to leverage those settings.)
Instead, you’ll set your PMax campaigns to the “in, or regularly in” targeting setting. This setting means ads will be shown to users who, according to Google’s AI, “are likely to be located in, or regularly located in, the locations you’ve targeted.” Be cautious here: Store visit conversions are not tracked the same way as other conversion goals, and they can easily knock planned geotargeting strategies out of gear.
A user does not need to be physically located in your targeted areas at the time of the ad serving to be shown the ad. Google’s system will deliver ads to users who also are regularly in your targeted areas. And “regular” to Google is probably not consistent with expectations. PMax campaigns targeting as few as 7 DMAs across the U.S. have been shown to have Maps channel delivery expanded across all 50 states without robust negative geotargeting.
How Display, YouTube, and Discover Get Left Fighting Over Scraps
Display, YouTube, and Discover ads are a great way to deliver additional upper-funnel impressions. Unfortunately, without impressive or immediate conversion volume, PMax campaigns rarely allocate spend to these awareness-focused channels. With most direct conversions occurring on Search or through DPAs, these channels get left by the wayside.
Excluding situations where Maps or Gmail traffic takes off following early conversion, Display and YouTube tend to be the second-highest spending channels within PMax, behind Search. But this is nowhere near a close second, amounting to only around 5% of total spend when product ads are present (and about 14% for campaigns without DPAs).
Finally, the ads delivered through the Discover channel tend to be allocated the least spend, averaging around 0.02% of PMax campaign spend. This is because the assets within PMax are easily suited for going straight into Search, YouTube, and Display. Additionally, Discover is used by fewer people—only 16% of users on Google Search.
Our Channel Performance Adjustment Toolbox
We’re glad to have this new visibility into the mechanics of PMax campaigns. The real question is: What will we do with these insights?
There are a few tricks you can use to push PMax in one direction, or to course correct wayward results. But without direct controls, it’s essential to get creative and try to think outside the box.
Here are a few of the tactics we’ve directly employed successfully:
- Adjusting ROAS targets more aggressively to limit upper funnel
- Shifting and removing assets
- Changing search theme coverage
- Targeting by language
- Breaking out narrow product-focused campaigns
- Increasing budgets to expand coverage
These are only a few examples. The sky is the limit!
It boils down to where the majority of your campaigns’ early conversions occur. If that skews heavily in a single direction, your PMax campaign may become overly simplified. If that’s not what you want, the power to adjust it is now in your hands!
Want to see how we can deliver for you on your goals? We’re happy to dig in and discuss strategies for optimizing your spend across channels. Reach out to us using our contact form, or connect with us on LinkedIn.